Determ is one of the most powerful and versatile tools for media monitoring and tracking brand metrics. It provides vast volumes of data that can help you improve your brand’s image.
Even so, tracking so many brand metrics can be overwhelming. Are you stuck during the analysis? Don’t worry; this handy guide will show you what each metric means and how you can use it – so that it all makes sense. Let’s get this!
Why Is It Necessary to Track Brand Metrics?
No matter how big or small your company is, tracking how customers perceive your brand is essential. It will help you see if you’re on the right track and where you can improve.
When you track brand metrics, you can get an idea of how your brand is doing in the online world. This data can help you improve your marketing strategy and make better decisions for your business.

Tracking metrics can also help you detect any negative sentiment about your brand so you can take steps to address it. This way, you can mitigate any potential brand damage.
A good set of data is the key to making informed decisions. So, getting straight to the point, let’s look at the metrics you will find in Determ reports.
Brand Metrics to Track
Mentions over time
This metric shows you the number of times your brand was mentioned online in a given period.
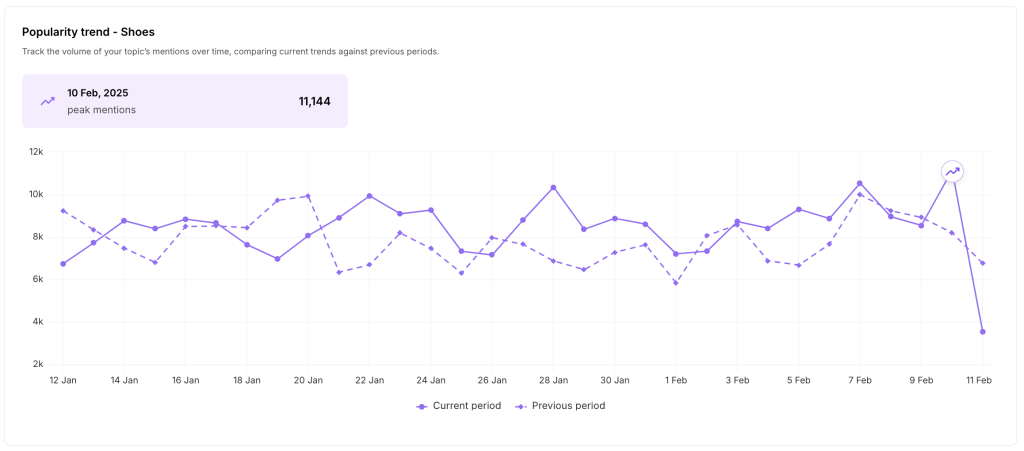
You can use this data to see how effective your marketing campaigns are. If you see a spike in mentions after launching a campaign, people are likely talking about it online.
Mentions over time can also help you see how well your brand is doing. If you see a sudden drop in mentions, it might indicate something is wrong. In this case, you can investigate further to find out the cause and take steps to fix it.
Read How To Write A Social Media Report: Guide For Beginners

Mentions over time by source
This metric shows you where and when your brand was mentioned online. It can be helpful to find out which platforms or websites are most commonly talking about you.

If your analysis requires just the information about sources of your mentions, and not the timing, Determ’s got you covered. This data lets you determine where your audience talks about you most. If you see that most of your mentions come from Twitter, then it might be a good idea to focus your marketing efforts on that platform.

Total impressions
It shows you the total number of times your brand was seen on social media, news, or blogs. It’s an excellent way to measure your brand’s reach and see how many people are exposed to your content.
You can use this data to track the effectiveness of your marketing campaigns and compare different strategies. For example, if you want to see which type of content gets the most impressions, you can compare the total number of impressions for each piece of content.

Positive-negative sentiment ratio
Based on this metric, you can see the ratio of positive to negative sentiment for your brand. It’s a good way to get an overview of how people feel about your brand and if you need to address any problems.
You can use this data to improve your marketing strategy and ensure that you create well-received content for your audience.

Key opinion leaders
A metric that shows you how many people and websites refer to your brand. It’s a good way to identify influencers and see how they spread the word about your brand. In Determ, you can analyze top influencers by:
- number of mentions
- source
- impressions
- sentiment
You can use this data to find websites and people to reach out to and build relationships with them for marketing purposes. It can also identify people who embody the brand’s values by searching for topics close to your brand. Use it to create content that will more likely interest their followers. These rankings can be a vital tool for boosting brand recognition.

Top locations
Based on this metric, you can see which countries are the most active in talking about your brand. It can help identify your primary markets and see how your brand is doing in different regions.

You can use this data to tailor your marketing strategy to specific markets and ensure you’re reaching your target audience.
Top languages
It indicates which languages your audience communicates in. It can help target specific markets or understand which regions mention your brand most often.
This data can tailor your content and marketing strategy to specific markets. For example, if you notice that a lot of chatter about your brand is happening in Spanish, you could create a Spanish website to appeal to that market.
Sentiment ratio
Sentiment is one of the most important brand metrics in social listening. It measures how people feel about your brand and can give you valuable insights into how customers perceive your brand.

The sentiment ratio is the percentage of positive sentiment to negative sentiment. A high sentiment ratio means that people have mostly positive things to say about your brand. Low – something is resonating poorly with the audience. If the sentiment ratio is unfavorable, it might be time to look closely at your marketing strategy.
Determ shows the ratio of positive, negative, and neutral sentiment in mentions of your brand. The data is automatically tagged, so you don’t need to do anything.
Sentiment over time
It’s a great metric showing how people change their sentiments over time. Did you recently launch a new campaign and see how your sentiment changed for the better? Great! It means that it brings expected results.

With this chart, you can also quickly identify spikes and drops – thanks to that, you can respond promptly to any heated discussion happening online and put out the fire before it even starts.
Determ also allows you to take a look at the sentiment ratio by channel. This helps you identify the overall sentiment values of each platform, which you can use in framing your strategy to mitigate the negative and emphasize the positive on each specific platform.

Conversational trends
Conversational trends are a visual representation of the most common words used to mention your brand. The bigger the word, the more often it is used.

You can use a word cloud to get a quick overview of what people are saying about your brand. In such a way, it gives you the context in which your brand is mentioned or allows you to locate your competitors by finding the most frequently used terms.
Read Discover New Information About Your Brand with Word Cloud
Where can you find all these metrics?
It’s pretty simple – you need to generate the reports from Determ’s dashboard.
Click on the Analytics tab.
Choose one of the ready-made templates or create your own from scratch.

You can download a standard (PDF) or PPT version.
In Determ, you can create branded reports – and easily personalize them to your needs. Upload your logo, change background colors, and tailor it to your brand.
To Sum Up
Determ is an invaluable resource for understanding the performance of your brand’s online presence. By analyzing the data, you can find what works and doesn’t and then make changes to improve your results.
We hope this article has helped you understand Determ’s brand metrics and given you some ideas for using them to grow your business.
Do you want to create Determ reports in minutes? Book your free demo and let’s help you set things up.


